"There are three kinds of lies - lies, damned lies, and statistics." - Mark Twain
How best do we measure player impact? Traditionalists argue first for the "eyeball test," I know it when I see it. Economists wave hands and argue for "fannies in the seats." And stat geeks seek reproducible data analysis.
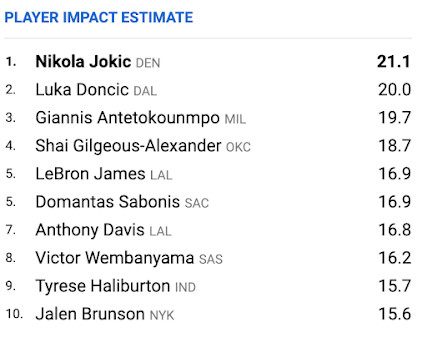
The NBA an WNBA have settled on PIE, Player Impact Estimate looking at each player's contribution relative to the team contribution. The total sums to 100 per game. The 'long-term' leaders are LeBron James and Tamika Catchings (WNBA) with about 17 percent ratings.
Player Impact Estimate (PIE)
Definition: PIE measures a player’s overall statistical contribution against the total statistics in games they play in. PIE yields results which are comparable to other advanced statistics (e.g. PER) using a simple formula.
Where the rubber meets the road. How do contemporary players rate?
2024 NBA PIE leaders reflect not only effectiveness but "ball dominance."Not surprising, Wilson also leads in PIE. The sample size for 2024 is small with relatively few games played.
Elephant in the room? Caitlin Clark is 42nd. Although she leads the WNBA in minutes played, she also leads the league in turnovers. Her assist/turnover ratio is low at 1.16 and her effective field goal percentage reflects the transition to pro status, checking in at 47.4, number 63 in the league. Part of the struggle relates to the overall weakness of her Fever club.
Lagniappe. Do you have D1 habits?
Everyone wants to be a D1 player. That’s great. Aim high. However, are u D1 off the court. Are uD1 in the classroom? Are u D1 with your sleep? Are u D1 with your eating habits? Are u D1 with your weight training? Are you D1 with your character & behavior? Only u know the answers
— Dennis Marshall (@mar5hallhoops) May 31, 2024
Lagniappe 2. Coach Hacks shares passing keys.
Post by @matt_hackenberg_basketballView on Threads

